
Live chart, live last candle
Closed bars from the snapshot plus a live forming candle and price line; a new closed bar regenerates the analysis silently.
ChartiQt turns a ticker and a timeframe into a complete chart: engine levels, pattern overlays, an AI outlook, 20-year probabilities and scored news - for US stocks, ETFs, indices, crypto, forex and futures.
Everything on the page comes from one immutable snapshot per ticker and timeframe - the same numbers the PNG export draws.
Closed bars from the snapshot plus a live forming candle and price line; a new closed bar regenerates the analysis silently.
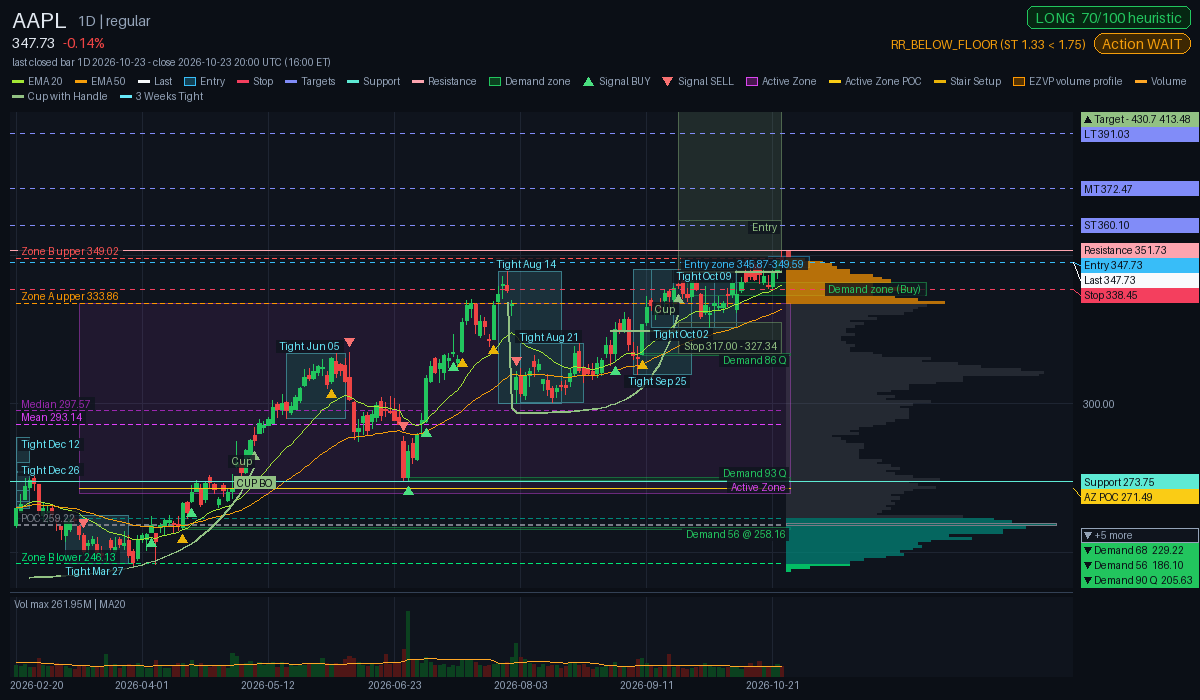
Entry, stop and ST / MT / LT targets as axis tags, with support, resistance and demand / supply zones - never computed on the forming bar.
A stance, conviction and bullets written against the engine and the 20-year model; every number is checked against the snapshot.
Walk-forward, calibrated analog model: the probability of an up move per horizon, a probability for the plan, and an analog cone drawn on the chart.
Scored headlines with a sentiment strip under the chart, earnings beats / misses, analyst moves and insider trades as markers.
US stocks, ETFs, indices, crypto (24/7), forex (24/5) and continuous futures - each on its own market hours and session rules.
Every chart has a PNG URL that works without a login - paste it in a chat or a bot and the image is served with the engine levels.
Horizontal lines and a freehand brush that stay put on pan / zoom, a navigation row, and older bars loaded as you scroll back.
A compact two-row header, a tall chart, and every panel under it as a one-line tap row - remembered per device.
The overlays are toggles in the chart legend. These four combinations are the ones we read first - each card is its own render with exactly those overlays on.
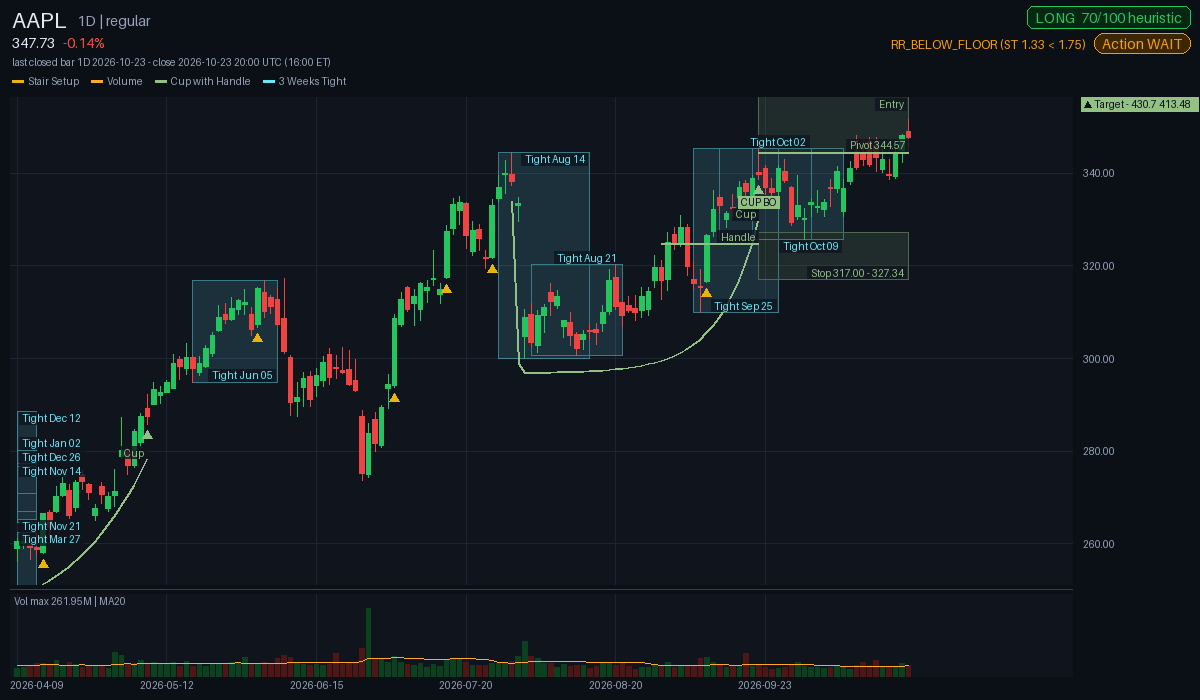
What it tells you: where the base is finished and the pivot sits, whether price is tightening into it, and whether volume confirms the push through.
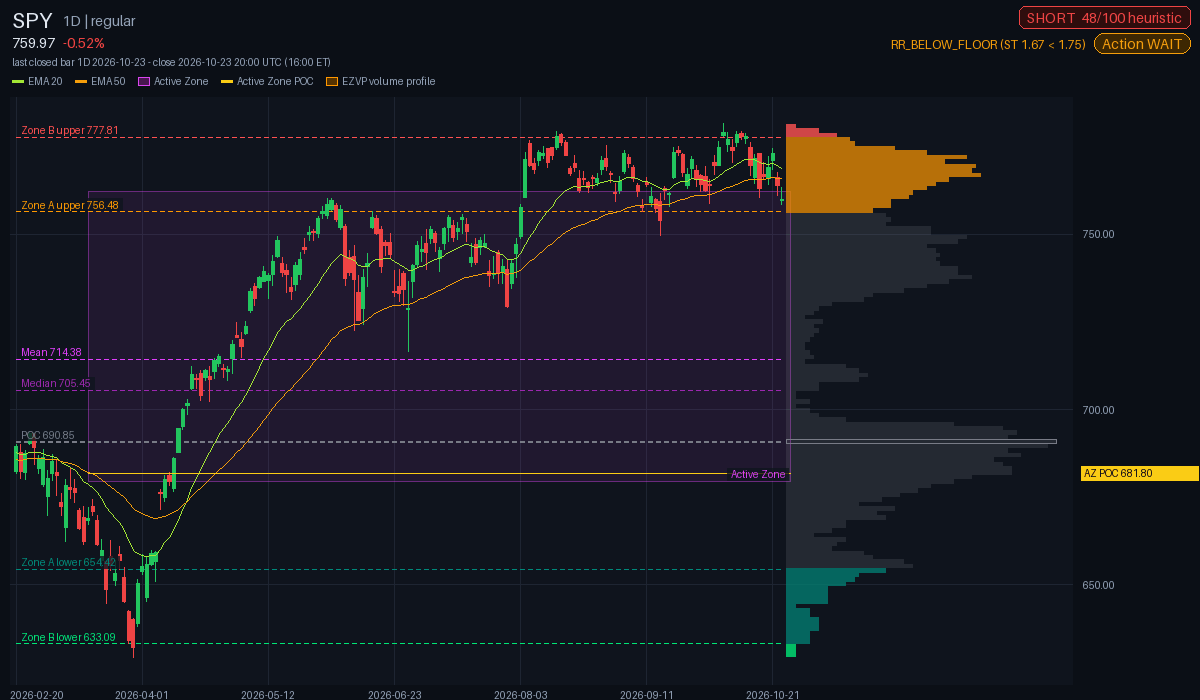
What it tells you: the direction of the trend, the price band most of the recent business was done in, and the single price with the most volume behind it.
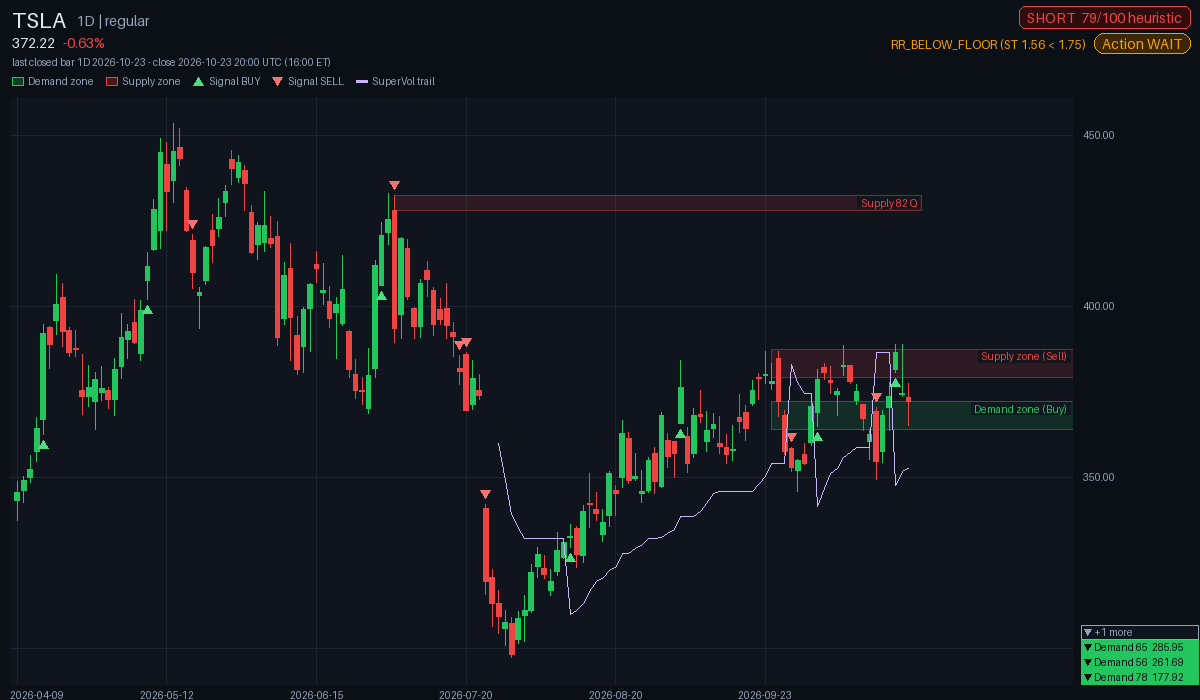
What it tells you: the zones where buyers and sellers last stepped in, the bars where a signal fired, and the volatility trail that has to flip before a turn is trusted.
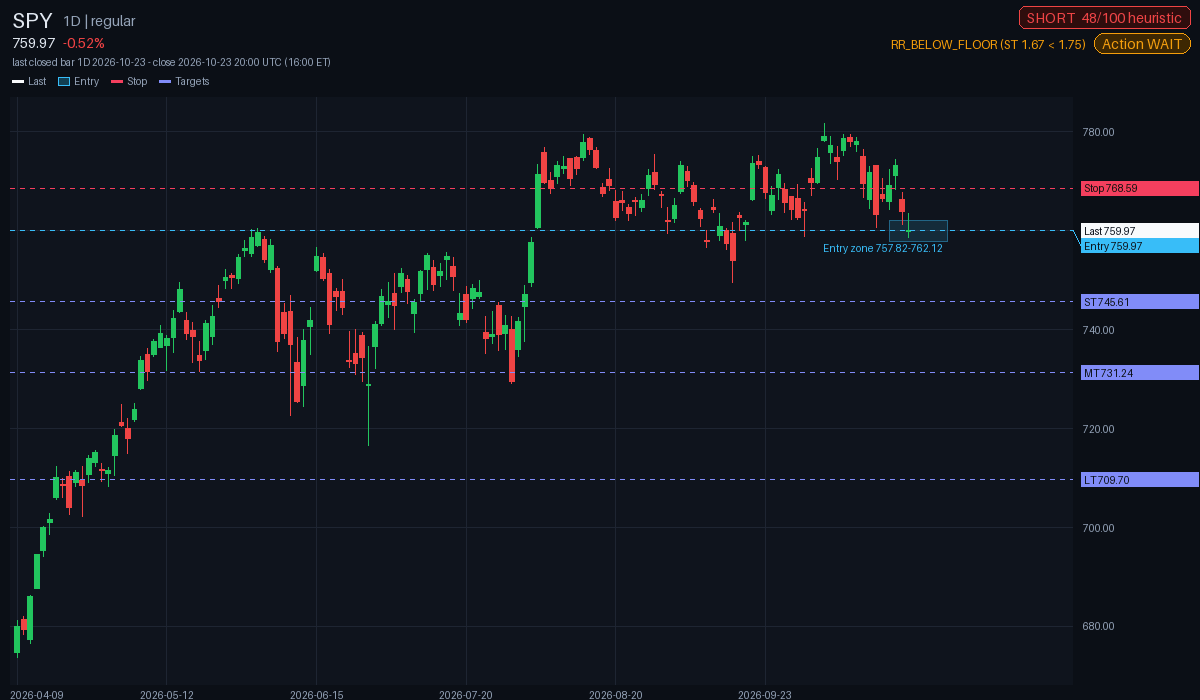
What it tells you: the exact entry zone, the stop under it and the ST / MT / LT targets above - with READY or WAIT and the reason, so a plan with too little reward stays a WAIT.
Three steps, no setup.
Search any US stock, ETF or index, or a crypto, forex or futures symbol; choose 1m to 1M and the regular or extended session.
The engines run on the closed bars and return one immutable snapshot; the chart, the levels and the panels all come from it.
Entry / stop / targets and the overlays on the chart, the AI outlook and the 20-year odds in the tiles - then download the PNG or copy the public image link.
Create an account - it is activated after a quick review - or sign in.